Vital Statistics
Our 15 gliders have recorded 348,650 profiles and racked up 11 years 106 days at sea covering 94518 km.During these missions our gliders have collected 859,179,326 data points.
Our 4 sailbuoys have spent 354 days at sea sailing 17,194 km
Since the beginning of March 2021 we have had at least one glider in the water 99.1 % of the time.
On average, we have had 3.5 gliders in the water during this period.
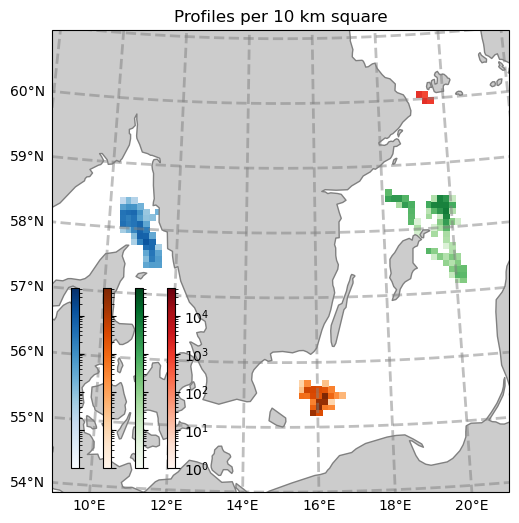
Spatiotemporal coverage
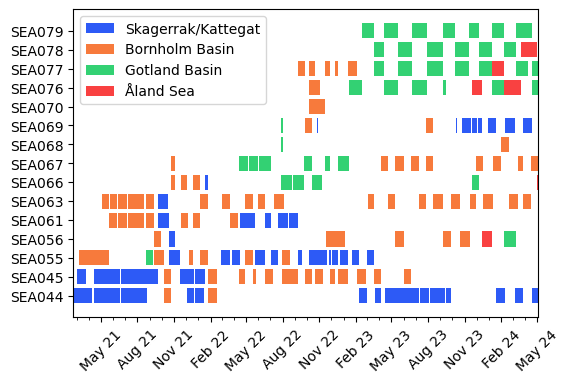
Stats by year
N.B. stats for 2021 are from 2021-03-01 to 2021-12-31. Stats for the present year are from the 1st of January up to today.
| Year | Glider Deployed | Skagerrak | Bornholm | Gotland | Åland | Total glider time | Total profiles | Mean gliders in water |
|---|---|---|---|---|---|---|---|---|
| 2021 | 100.0 % | 95.8 % | 89.4 % | 5.9 % | 0.0 % | 2 years 313 days | 92230 | 3.3 |
| 2022 | 97.0 % | 80.8 % | 93.2 % | 56.7 % | 0.0 % | 2 years 349 days | 124501 | 3.0 |
| 2023 | 100.0 % | 80.2 % | 98.5 % | 100.0 % | 12.2 % | 3 years 282 days | 93013 | 3.7 |
| 2024 | 100.0 % | 99.9 % | 99.9 % | 100.0 % | 99.9 % | 1 years 194 days | 31603 | 4.9 |